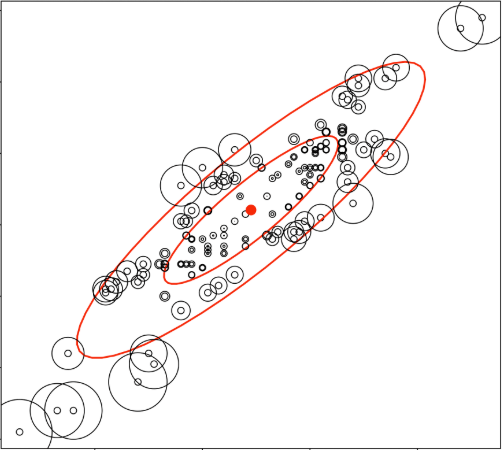
The Mahalanobis Distance, widely used in cluster and classification algorithms, can be quite useful to detect outliers in multivariate data. [1] What exactly is it?
To understand what it’s trying to calculate, let’s use an analogy.
Is it Getting Hot in Here?
Let’s make some tacos. For each taco, we have the following ingredients:
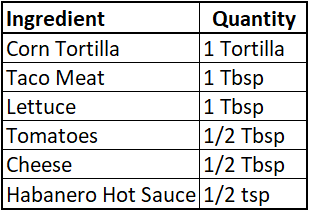
Let’s assume that our spice tolerance was mild, and a few more drops of the hot sauce would make the tacos unpleasant on the palate. Now, envision that the quantity of our ingredients were the coordinates in our axes. A small increase in taco meat would not alter the recipe or desirability of the taco on a large scale. Nor would a small decrease in cheese impact the taste test. However, doubling the hot sauce would alter the small “ohh I like this” kick in the back of your throat to a dizzying “I want to die” ball of fire in your mouth.
So, the Mahalanobis Distance is not necessarily trying to explain distance from the quantity (volume) of ingredients, but rather it’s trying to identify which variables are most sensitive to variation. By doing so, we can identify outliers easier. We know that the 5th taco we made with 2 teaspoons of hot sauce is not similar to the first four and will not yield a “yummm” when we sink our teeth into it.
Mathematical Calculation
Mathematically, the Mahalanobis Distance (MD) is calculated as:
MD2 = (x – m)V -1(x – m)
where:
x is a vector of values for a particular observation
m is the vector of means of each variable
V is the variance-covariance matrix
[2]
The idea is to calculate the covariance matrix of each class to help identify the relative distance between the two attributes from their centroid, a base or central point that is the overall mean for multivariate data.
Excel Calculator [3]
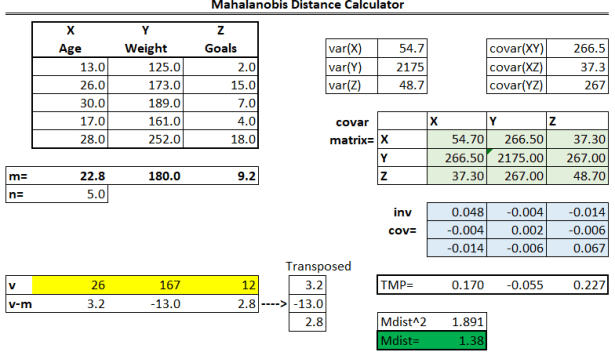
We can create a simple calculator in Microsoft Excel to showcase the steps.
Now, there are a 9 sections we should focus on.
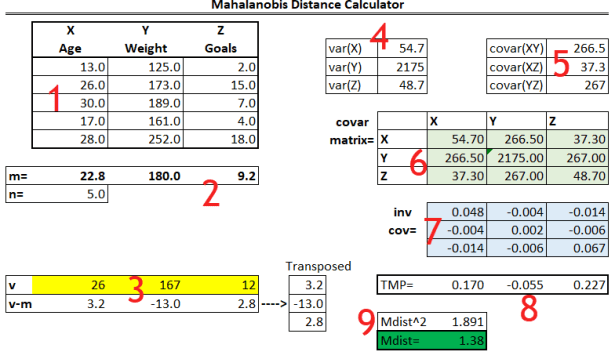
Section 1: Raw Data
We input the raw data for the three variables: Age, Weight, # Goals
Section 2: Means and Sample Size
We then calculate the means of each variable. n=5 because there are 5 observations.
Section 3: Input Data and Find Difference
We input data we want to find the distance from the mean (v) and then we calculate the difference between the new vector and the mean vector.
Section 4: Calculate Variance for Each Variable
Leveraging Excel’s =VAR.S() function, we calculate the individual variances for each variable.
Section 5: Calculate Covariance For Possibilities
Leveraging Excel’s =COVARIANCE.S() function, we can calculate the covariance for XY, XZ, and YZ.
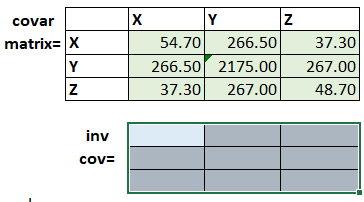
Section 6: Create Covariance Matrix
We then create a covariance matrix (labeled covar matrix) by inserting the outputs from sections 4 and 5.
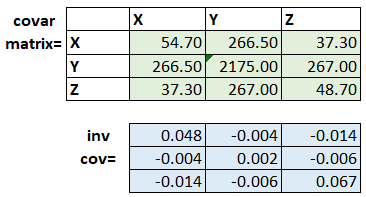
Section 7: Inverse Covariance Matrix
Through leveraging Excel’s Array formulas, we can calculate out the inverse covariance matrix. Here are the steps:
- Highlight the inverse covariance matrix (from the top left to bottom right)
- Enter the formula: =MINVERSE(CovarianceMatrix) where CovarianceMatrix is the Covariance Matrix cell block (I’ve named that range CovarianceMatrix)
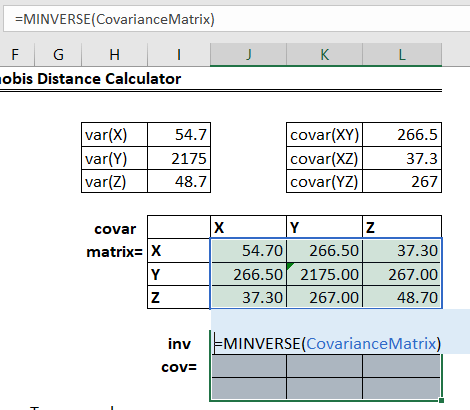
- Hit Ctrl+Shift+Enter and the cells should populate
Section 8: Calculate TMP
To calculate TMP, we need to create another array formula. This time, we want to use the =MMULT() function to multiply the v-m vector with the inverse covariance matrix. Try and figure out how to do so by applying the steps above!
Hint: =MMULT(v-m Vector,Inverse Covariance Matrix)
Section 9: Calculate Mahalanobis Distance
The last step! All we have to do is use =MMULT() again to multiply the TMP and transposed v-m vectors together to get the Mdist^2. To get Mdist, we simply take the square root of the above output using =SQRT().
Conclusion & Excel Workbook Link
Now that we’ve calculated it out in Excel, the puzzle pieces should start making more sense. We just created a covariance matrix, took the inverse of the covariance matrix, multiplied that inverse covariance matrix with the difference of the target vector to the mean, multiplied that output with the transposed difference, and then took the square root of the output.
Please let me know if there are any questions or concerns down in the comments section. I am fairly new at calculating the Mahalanobis Distance, so please do let me know if there are any errors!
OneDrive Link to Excel Calculator
——————
[1] Penny, Kay I. “Appropriate Critical Values When Testing for a Single Multivariate Outlier by Using the Mahalanobis Distance.” Applied Statistics, vol. 45, no. 1, 1996, p. 73., doi:10.2307/2986224.
[2] http://geog.uoregon.edu/bartlein/courses/geog495/lec18.html (For featured image too)
[3] https://jamesmccaffrey.wordpress.com/2017/11/09/example-of-calculating-the-mahalanobis-distance/
