Initial r/Financial Independence 2018 survey results are in! Here’s a quick and dirty dive into the survey results (we will go deeper in due time… don’t you worry ;)). For those not familiar with Financial Independence, it’s a concept where you earn more, spend less, and invest the rest, while discovering and achieving your life goals! Usually this is achieved by saving a larger portion of your income, creating a nest egg that will hit a point at which withdrawing a certain amount per year will yield a livable income stream in perpetuity.
After downloading the survey raw file found here into Excel, I started to clean the data. The structure of the survey, exported into a spreadsheet, was not extremely user friendly.
I only kept respondents in the United States (sorry non-U.S. readers!) and those who have not achieved financial independence yet. Furthermore, I broke the vast majority of columns into two tables linked by an assigned Record ID, and created a data model for analysis (in case we wanted something from the second table). I also bucketed a few answers for easy analysis, such as annual household income and net worth. Yeah, yeah, blah blah blah get to the good stuff already!
We looked at 1496 respondents’ submissions after the initial sweep.
Here are a few highlights from the demographics portion. I won’t include all of them, since there will be a lot of information… If you want to play around in Excel, here is the OneDrive link to the workbook! Download it into your local machine and start clicking away 🙂
Without further ado, here is some general demographic information!
Gender
- 78% of respondents were male
- 20% of respondents were female
- The rest either declined to state or was non-binary
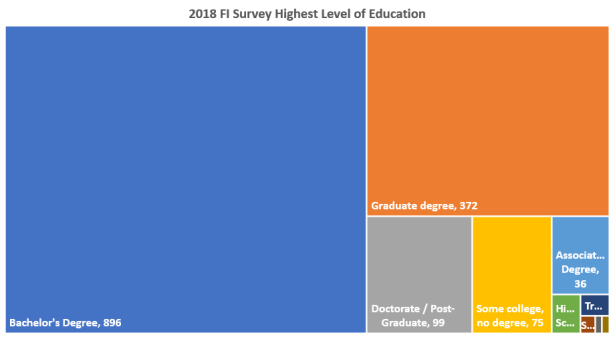
Highest Level of Education
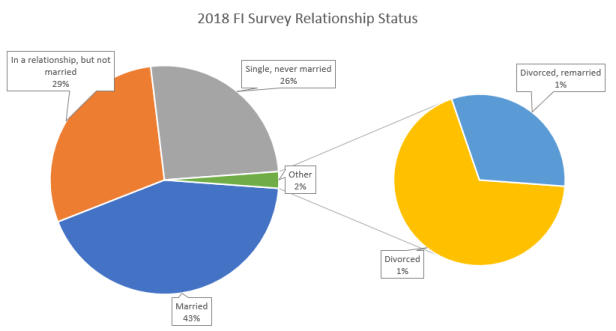
Relationship Status
Full-Time Employment Status
- 92.8% of respondents worked for an organization
- Only 1.6% of respondents were self-employed!
Political Party
- 51.0% of respondents were Democrats
- 19.9% of respondents did not affiliate with a Political Party
Occupation
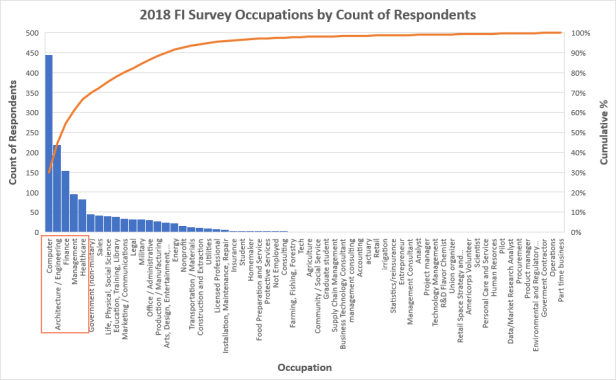
The top 5 occupations were: Computer, Architecture/Engineering, Finance, Management, and Healthcare. These five accounted for 66.6% of all occupations!
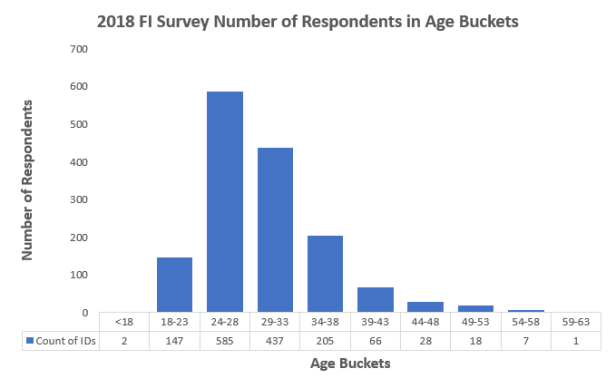
Age Groups
Children (Planned or Have)
- 77% of respondents did not have and do not plan to have children!
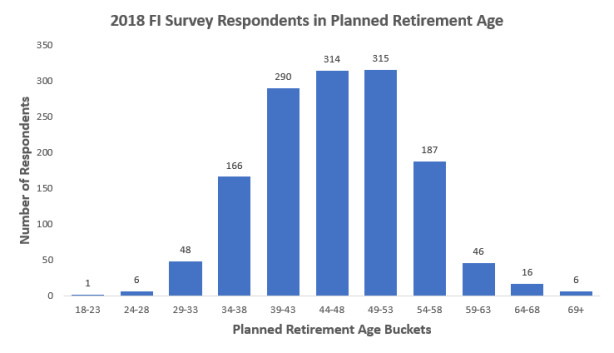
Planned Retirement Age
Next, let’s get to the good stuff…
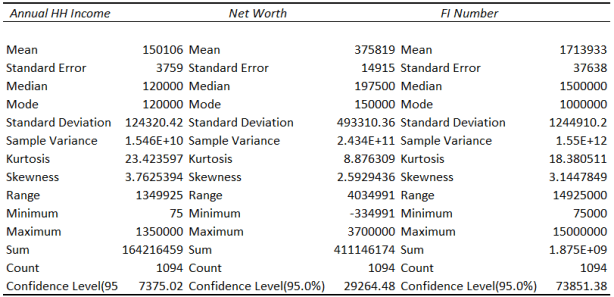
Let’s take a gander at the numbers; specifically, let’s look at annual household income, financial independence number, and percent to FI.
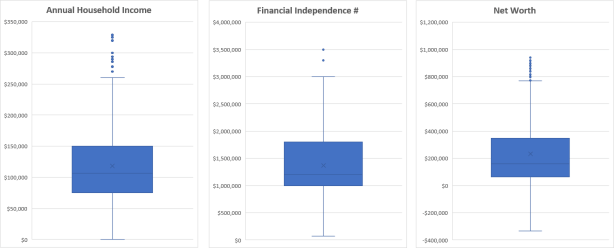
Here are the summary statistics for the three:
In a more visual representation, we see that there are quite a few suspected outliers outside of the inner fence (see here for an explanation on how to read box-and-whisker plots)
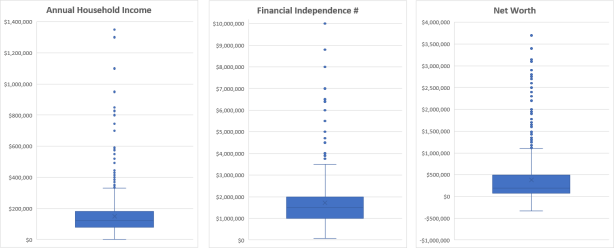
We can see that there’s quite a variance in what respondents earn and their net worth. Not only that, but their idea of financial independence differs greatly, with some respondents only happy when they reach the multi-million dollar mark, and others when they break a few hundred thousand in net worth.
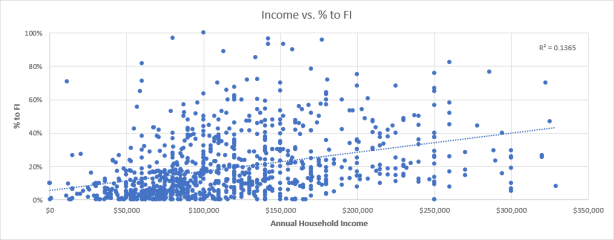
Let’s look at how annual household income is correlated to % to FI:
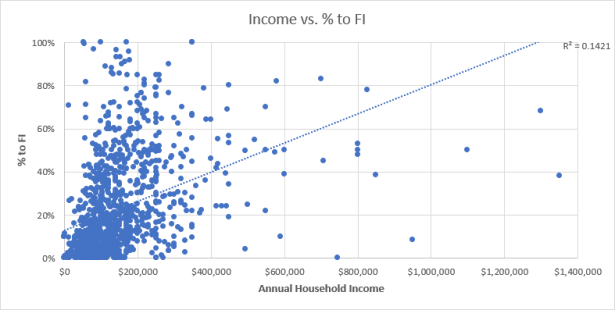
It looks like it’s weakly positively correlated. However, this isn’t the best fit, with 86% of the variance in the model unexplained (r squared of .14, 1-.14 = .86).
Cleaning up the raw data to only include non-suspected outliers and outliers, we end up with this box-and-whisker plot:
It looks much cleaner; how does our Scatterplot look?
Our goodness of fit has decreased from 14.21% to 13.65%?! This perhaps intuitively makes sense, as someone in his late 40’s may be earning well into the six figures, but they only discovered FI a year or two ago, while a 28 year old college grad maxing out his 401k every year since graduation may think $400k is enough for lean FI, bringing his % to FI in the 20%’s! Let’s take a look at some Pivot Tables to see if this is true:
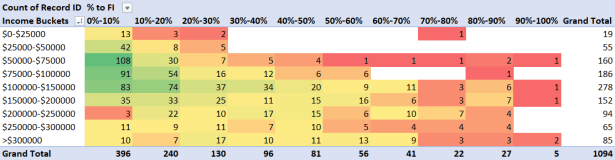
It looks like the majority of respondents are still in the first half of their journey towards financial independence. Let’s break this down by age buckets:
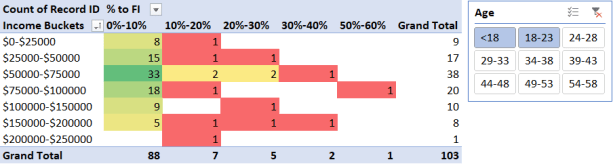
With a slicer, we can see only respondents in the <18 and 18-23 buckets. It looks like the vast majority are in the 0%-10% bucket towards FI, but there are a few high achievers. Keep in mind that their end goal can affect their coding (i.e. if they believe they will reach financial independence at $250,000, they will need $25,001 to be in the 10%-20% bucket, whereas if they believe they need $2,500,000, then they’ll need $250,001 to be in the same bucket).
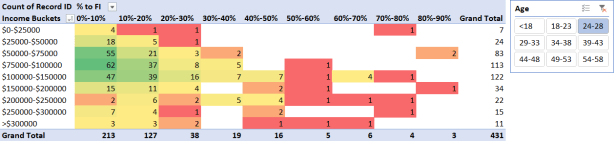
At ages 24-28, we not only have more respondents in general, but also more respondents are inching towards the 10%-20% bucket.
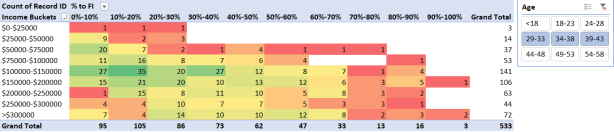
When looking only at age 29-43 buckets, we see that a lot of the respondents are in the mid-game. However, we also see that the largest two buckets are 0%-10% and 10%-20%! Even if someone in this category is making six figures, they still have a decent chance of being in the 0%-20% buckets. This could help explain why the Scatterplots were all over the place!
To be continued…
My next goal (after finals, yes I’m procrastinating) is to create a step-wise multiple logistic regression model to calculate the chance of being 0%-10%, 10%-20%, etc. towards FI based on a few statistically significant explanatory variables. To make this interactive, I want to create a calculator in Excel to output the probability!
If you have other questions you want answered with the data, please do not hesitate and leave a comment!

Really cool stuff here. Have you been acquiring knowledge on how to do this over time or is there a specific course you’d recommend looking up in order to produce similar charts?
LikeLike
Hi John. Thank you for your kind words.
I use excel and other software to analyze and visualize data everyday at work. Furthermore, I create dashboards for my personal and family’s finances to visualize income and expenses and net worth. I have also taken numerous data analysis courses at the masters level and via online learning platforms such as EdX and YouTube.
Microsoft offers high quality excel courses on EdX (introduction to data analysis) for free. Perhaps look through EdX and Coursera and see if there’s anything that piques your interest! Furthermore, Excelisfun has extremely high quality excel videos on YouTube.
If you have any further questions, don’t hesitate to reach out to me!
LikeLike
Hey Wayne, interesting statistics on what is probably the largest FIRE community on the web!
What I wonder about is how these statistics differ from the average Reddit user. For example, does the FIRE community on Reddit (on average) have different education or political beliefs than the rest of Reddit? This could show the difference between a FIRE-pursuer and the general (Reddit) population. And even though only 20% of the dataset is female, I’d be curious to see if they differ from the male respondents in any other aspect.
Looking forward to your future posts!
LikeLike
Hi Macro!
Great question. I want to point out that even though >1,000 people responded to this survey, the subset within r/financialindependence that chose to respond could potentially be skewed, and thus the survey respondents potentially won’t give an accurate depiction of the demographics of the whole subreddit.
I wonder if we’re able to poll reddit as a whole, or if we would need to poll each subreddit one by one.
Do you have any aspect in mind for a difference between genders?
LikeLike
Maybe there already are some statistics/polls for Reddit as a whole. (I have not checked)
As for the gender differences, I wondered if the female and male respondents differed in their planned retirement age, desire to have children, or occupations. Women live longer than men, so their retirement planning might be different.
LikeLike
Hi Wayne,
Do we have a question related with # of child? I think this could be an influential feature affecting FI’s status.
Great analysis! Keep it up!
Bing
LikeLike
Hi Bing,
Great question. Out of the 1496 U.S. respondents, 77% (1152) did not have and do not plan to have children. This is ridiculously high!
Furthermore, 9.4% (140) and 7.8% (117) of respondents have/plan to have 1 or 2 children, respectively.
This can be found in the OneDrive workbook under the “Age and Children” tab.
Cheers,
Wayne
LikeLike
Hey John, great analysis and charts! Really puts the raw data in perspective. I would be curious to see what the Financial Independent number would be on a per capita basis. In the raw data, lot of data points were households of 2 (married or relationships) which mixed with the single folk will give data that is somewhere in the middle of the two as far as analysis goes.
LikeLike
Definitely agree with Marco — I think the heavy skew toward younger people has to do with the age group that uses reddit. This age skew has a few results: lower education levels (more with Bachelor’s Degree only), lower income levels due to low experience, and lower work-jadedness.
I believe the respondents’ high FI dollar number relates to their age. Younger people tend to be optimistic about their job future, assuming that they will love working and have great bosses, etc. The older you get, the more you think, “Hmm. Working for someone else kind of sucks… Maybe I’d be happier at a lower FI number if I could just retire early and work for myself.”
In addition to a young-people skew, there are also going to be a lot more tech people in the data, as reddit is a more integral part of tech culture than other fields like medicine, esp those that don’t involve sitting in front of a computer with coworkers all day. The fact that the leaders of the FI blogging movement are mostly in tech doesn’t hurt, either.
LikeLike
Wow, fantastic job breaking all this down. I love seeing others goals on FI. The spread on the FI numbers is pretty dramatic. I wonder how anybody could consider themselves independent at only $75k. It would be great if the next go around we could get a broader audience to respond and get a better picture of how the community is really doing.
No surprise that nearly everyone in the community plans to retire before the age of 65.
LikeLike