
How has the size of housing in the U.S. changed over the past century or so? With data collected from the BLS, Census Bureau, and other sources, I took cross sectional data from each year to find the average floor area (square feet) and also average floor area (per person also in sq ft). The data represents newly built single-family homes, specifically the average size; this may prove sub-optimal, as a small subset of extremely large (or small) houses could potentially skew the numbers. Regardless, the results were quite interesting.
Over time, we can see that the average floor area has been steadily increasing. According to the linear regression equation on the chart, an increase in one year will yield an 18.5 square feet increase in the average floor area.
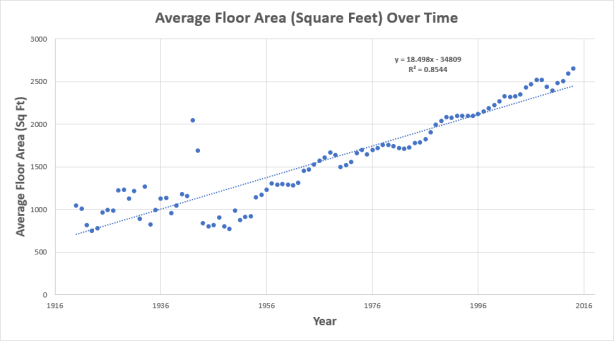
Predicted (linear) Average Floor Area = 18.498x – 34,809
where x = Year
An example would be to plug in the year 2020
Average Predicted Floor Area = 18.498 x (2020) – 34809 which equals 2,556.96 square feet
This scatter-plot shows the average floor area in square feet per person:

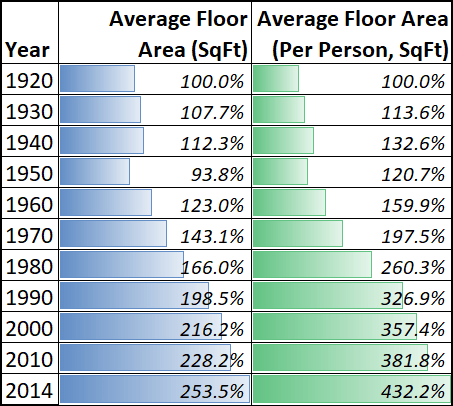
Albeit hard to see, the square foot per person has increased at a much faster rate than only square feet. This may be a better representation of the information:
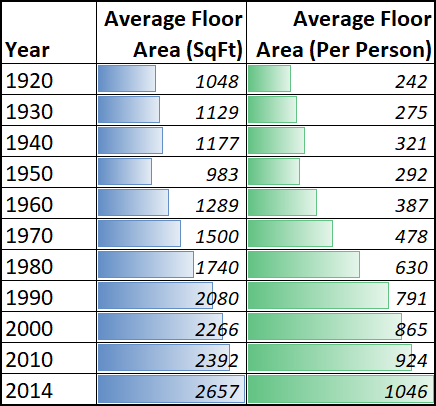
We see that from 1920 to 2014, much has changed regarding the size of houses and also how much space people have. Over the past 95 years, average floor area has increased from 1048 square feet to 2657 square feet, which equates to a 2.5x increase! Furthermore, the average floor area per person has more than quadrupled, from 242 square feet to 1046! Essentially, it’s likely that one person nowadays has the same amount of space as a family back in the 1920s!
Using 1920 as the base year:
So we know that there has been a dramatic increase in average housing size and average floor area per person. But why? Well, there are numerous factors, but we could potentially take a look at a few:
- Unethical realtors who push larger mortgages to home buyers
- Ease of access to credit
- Influx of population to suburbs, where housing is cheaper per square foot compared to cities
- Single occupancy rate has more than tripled, from 7.7% in 1940 to 26.7% in 2010!
- Average household size has simply decreased, driving the per person ratio higher- according to the U.S. Census, the average household size has decreased from 3.33 in 1960 to 2.54 in 2017
- “Keeping up with the Jones'” or “American Dream” Mentality
- More complex and robust advertising and sales platforms, connecting seller to buyer more efficiently, thus driving demand
These only touch the tip of the iceberg. Are there any more? Comment them below 🙂

People are bigger. This is because of obesity yes, but today most people are larger than someone in the 1940’s. A big problem in World War II was so many of the US recruits had malnutrition from the Great Depression and were under the minimum height / weight initially.
Also in some cities they require a very large lot size in order to force the building of an expensive house, thus keeping the “undesirables” out. Austin, Texas, with it’s 6,100 ft minimum lot size, is ground zero for this.
LikeLike
I think you mean 18.5 square feet increase in the average floor area *per year*
LikeLike
Hey josh,
Thanks for the comment. Yes, you’re right :). Let me reword it.. It doesn’t seem very clear in its current state.
LikeLike
Supply and demand. Builders build houses that will sell. It has nothing to do with unethical realtors or advertising. New construction homes that are smaller than the median home (and priced reflectively) in a given market area will take significantly longer to sell than homes at the median or above. Home buyers typically comment that they want the largest house that they can afford.
LikeLike
I am a luxury homebuilder. Buyers want to buy homes at as cheap a cost per square foot as possible. If you build a larger home on a lot of the same cost, then the cost per square foot will be lower, including the cost of the land.
LikeLike