
What exactly is a Pivot Table?
A Pivot Table is a tool in excel used to help summarize and visualize data in many ways. It does not change the raw data itself. Even though this is a basic method of reporting, no one should overlook the power of pivot tables!
Who would have uses for Pivot Tables?
Anyone and everyone! From senior management trying to make sense of sales data, to your everyday person trying to organize personal finances (see bottom of post!), pivot tables help organize and see data in different ways at the drop of a dime!
Why are Pivot Tables so important?
As a data set grows, it doesn’t make sense to report data anymore in a proper table format, where there are column headers and individual records. We need another way to spin the data to present what we want to see in an efficient manner.
Proper Table Format
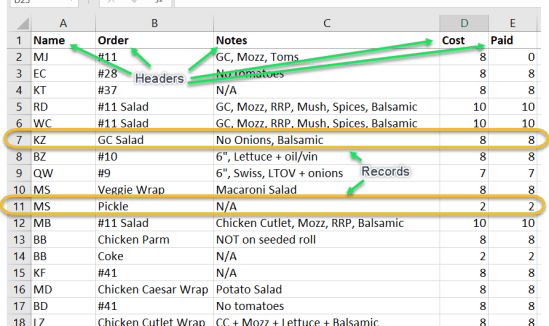
As the number of records (rows) grows, how do we know exactly how many of each order was placed? How can we summarize how much the total cost is? How do we know who paid what? Pivot tables will help organize and present this information!
Supply Chen Management’s “Introduction to Pivot Tables” series
Video 1/3
-What is a pivot table?
-What is a proper table format?
-How to create a pivot table?
Video 2/3
-Shape the pivot table
-Subtotal
-Expand/collapse
-Different ways to summarize value fields
Video 3/3
– Group Dates (Years, Quarters, Months)
-Slicers
-Timeline
Congratulations on making it through all three videos! Hopefully you have a better understanding of how powerful pivot tables can be. Keep an eye out for the “Intermediate Pivot Tables” series where we will create visuals and dashboards!
There are so many different options available for Pivot Tables; hopefully I’ve covered enough to get you started. The best way to learn is to do, so get your hands dirty with some pivot tables. (see below for the Personal Cash Flow Template)
Can you spot the pivot tables in Supply Chen Management’ Personal Cash Flow Template? Play around with it to see what’s possible! Can a slicer or timeline be added to better visualize monthly income and expenses? How can we connect a slicer or timeline to both pivot tables? Stay tuned for the Intermediate Pivot Tables series! (or if you can’t wait, contact me here and I will share).
